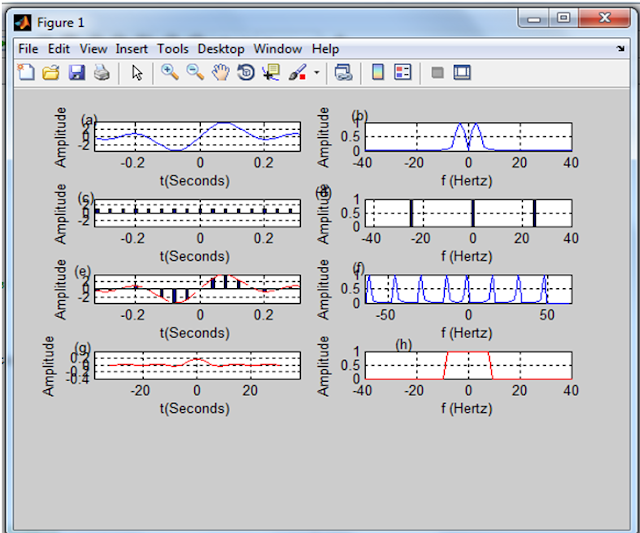
Sampling and reconstruction of signal > Matlab
Sampling and reconstruction of a signal > Matlab
Digital Signal Processing
%Showing the Uniform
sampling reconstruction
close all;
clear all;
N=64;
Fs=100; %Sampling
frequency
Ts=1/Fs; %Sampling time
t=Ts*[-N/2:N/2-1]
fo=2;%Fundamental
frequency
f1=4;%Fundamental
frequency
s=2*sin(2*pi*fo*t)+2*sin(2*pi*f1*t);
subplot(5,2,1)
plot(t,s)
xlabel('t(Seconds)','fontsize',10)
ylabel('Amplitude','fontsize',10)
axis([-0.33 0.31 -3.6
3.6])
text(-0.37,4.2,'(a)')
box on
grid on
% Plotting the Frequency
spectra
f=1/Ts/N/2*[-N:2:N-1];
s_f=fft(s);
subplot(5,2,2)
plot(f,fftshift(abs(s_f/max(s_f))))
xlabel('f
(Hertz)','fontsize',10)
ylabel('Amplitude','fontsize',10)
axis([ -40 40 0 1])
text(-45,1.25,'(b)')
box on
grid on
%Creating train of
impulses
x_range=[0:1:63];
imp_train=zeros(1,64);
select=find(rem(x_range,4)==0);
imp_train(select)=
ones(size(select));
subplot(5,2,3)
bar(t,imp_train)
xlabel('t(Seconds)','fontsize',10)
ylabel('Amplitude','fontsize',10)
axis([-0.33 0.31 -3.6
3.6])
text(-0.38,4.0,'(c)')
box on
grid on
%Creating frequeny
spectra of the spikes
imp_train_f=fft(imp_train);
subplot(5,2,4)
bar(f,fftshift(abs(imp_train_f/max(imp_train_f))))
xlabel('f
(Hertz)','fontsize',10)
ylabel('Amplitude','fontsize',10)
text(-64,1.25,'(d)')
axis([ -44 40 0 1])
box on
grid on
%Multiplying spikes with
signal in time domain
imp_train_s=imp_train.*s;
subplot(5,2,5)
hold on
bar(t,imp_train_s)
plot(t,s,'--r')
hold off
xlabel('t(Seconds)','fontsize',10)
ylabel('Amplitude','fontsize',10)
axis([-0.33 0.31 -3.6
3.6])
text(-0.39,4.5,'(e)')
box on
grid on
%Convolving the
Frequency spectra of the spike and frequency spectra of signal
Conv_imp_s_f=conv(s_f(:),imp_train_f(:))
length_output=length(s_f)+length(imp_train_f)-1;
k=linspace(-2*N/2,2*N/2,length_output);
subplot(5,2,6)
plot(k,abs(Conv_imp_s_f/max(Conv_imp_s_f)))
xlabel('f
(Hertz)','fontsize',10)
ylabel('Amplitude','fontsize',10)
text(-72,1.25,'(f)')
axis([-65 65 0 1.0])
box on
grid on
%Constructing a sinc
function
%Constructing a Box car
function
x_range=[0:1:63]
rec= zeros(1,64);
select
=find(x_range>26 & x_range<38);
rec(select) =
ones(size(select));
subplot(5,2,8)
plot(f,rec,'r-')
xlabel('f
(Hertz)','fontsize',10)
ylabel('Amplitude','fontsize',10)
axis([ -40 40 0 1])
%axis([-25 25 0 1])
text(-28,1.25,'(h)')
box on
grid on
%Constructing a sinc
function
subplot(5,2,7)
sinc =
real(fftshift(ifft(fftshift(rec))));
plot([-32:31], sinc,
'r')
xlabel('t(Seconds)','fontsize',10)
ylabel('Amplitude','fontsize',10)
axis([-38 38 -0.4 0.4])
text(-45,.5,'(g)')
box on
grid on
Output:


Comments
Post a Comment