To plot standard DT signals > Matlab
To plot standard DT signals > Matlab
Digital Signal Processing
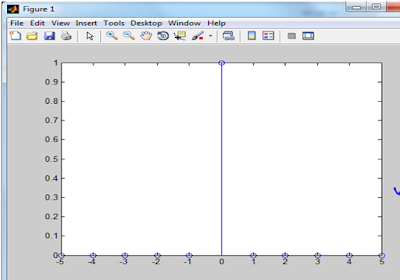
1)UNIT IMPULSE
n1=input('Lower limit')
n2=input('Upper limit')
x=n1:n2;
y=[x==1];
stem(x,y);
2)UNIT
STEP
(A)DISCRETE
n1=input('Enter
the lower limit');
n2=input('Enter
the upper limit');
n=n1:n2;
x=[n>=0];
stem(n,x);
title('Unit
Step Signal - Discrete');
(B)CONTINUOUS
n2=input('Enter the upper limit');
n=0:n2;
x=[n>=0];
plot(n,x);
title('Unit
Step Signal - Continuous');
3)UNIT RAMP SIGNAL:
n1=input('Enter
lower limit');
n2=input('Enter
upper limit');
n=n1:n2;
x=n.*[n>=0];
subplot(2,1,1);
plot(n,x,'r');
title('Continuous');
subplot(2,1,2);
stem(n,x,'b');
title('Discrete');
4)EXPONENTIAL SIGNAL
n1=input('Enter
lower limit');
n2=input('Enter
upper limit');
t=n1 : n2;
a=input('Enter
the value for a');
y=exp(a*t);
subplot(2,1,1);
plot(t,y,'r');
title('Continuous');
subplot(2,1,2);
stem(t,y,'b');
title('Discrete');
5)SINUSOIDAL SIGNAL
x = 0:pi/20:2*pi;
subplot(3,1,1);
plot(sin(x))


Comments
Post a Comment